Research moderators activity in the Streamlit community. Dask, Pandas, Seaborn
I'm curious how well the Streamlit company develops its community . To make it better, a lot of questions from very beginners to advanced users have to be answered or, at least, responded to in a reasonable time. Fortunately, the community forum is based on the broadly spread forum engine Discourse . The engine exposes API and all the data can be pulled out from the website to analyze later on for how actively the empowered users(moderators) communicate to people.
To represent the activity the following subjects are researched:
-
Moderatos summary view.
-
Responded topics distribution.
-
First response delay stats.
-
Common delay stats.
To reveal the details about them data, first of all, are collected and then preprocessed into the compact format parquet.
Collect and view data
The two objects are requested from the website topic and post. Topic is nothing than the first post wrapped up with additional information. Both are accessable through the api endpoints:
https://{defaultHost}/latest.jsonhttps://{defaultHost}/t/{id}/posts.json
The suffix .json of an endpoint says that all the topics and posts you see on a web page are downloaded as json documets, very handy for machine processing. For example, https://discuss.streamlit.io/t/31582.json.
The whole history of documents has been downloaded by me, not worth to desctibe it here.
What a file content is, how it looks like?
Files overview
There are thousands of small json files on disk named like topic-4288.json.
$ find /collected -name "topic-*" | wc -l
25139
Each of them contains the topic's posts in the following structure
$ jq -r . files/topic-4288.json | head -n 9

{
  "post_stream": {
    "posts": [
      {
        "id": 12049,
        "name": "Yordan Radev",
        "username": "StuckDuckF",
        "avatar_template": "/user_avatar/discourse.holoviz.org/stuckduckf/{size}/4347_2.png",
        "created_at": "2022-09-22T19:27:47.715Z",
The whole file topic-4288.json .
Sample overview
What information should be extracted from every single topic? Taking a deeper look.
import json
import pandas as pd

with open('files/topic-4288.json') as file:
     topic = json.load(file)

df = pd.json_normalize(topic)
sample = pd.concat([df.dtypes.to_frame(), df.sample(1).T], axis=1)
| timeline_lookup | object | [[1, 2]] |
|---|---|---|
| suggested_topics | object | [] |
| tags | object | [] |
| id | int64 | 39050 |
| title | object | Streamlit Drawable Canvas issue |
| fancy_title | object | Streamlit Drawable Canvas issue |
| posts_count | int64 | 1 |
| created_at | object | 2023-03-09T17:06:26.380Z |
| views | int64 | 20 |
| reply_count | int64 | 0 |
The whole file sample-overview.txt .
Normalize json to dict records unfolding nested posts list and adding meta columns. The function is used later on while distributed computing.
def get_posts(json_data, as_df=False) -> pd.DataFrame:
    df = pd.json_normalize(json_data,
                            record_prefix='post.',
                            record_path=['post_stream', 'posts'],
                            meta_prefix='topic.',
                            meta=['id', 'created_at'])
    if as_df:
        return df

    return df.to_dict('records')

topic_posts_sample = get_posts(topic, as_df=True)
| post.id | 83797 |
|---|---|
| post.name | Chinar Dankhara |
| post.username | chinardankhara |
| post.avatar_template | /user_avatar/discuss.streamlit.io/chinardankhara/{size}/20276_2.png |
| post.created_at | 2023-03-09T17:06:26.464Z |
| post.post_number | 1 |
| post.post_type | 1 |
| post.updated_at | 2023-03-09T17:06:26.464Z |
| post.reply_count | 0 |
| post.reply_to_post_number |
Information in the fields topic.id, post.user_id, post.username, post.id, post.created_at, post.post_number, post.staff, post.moderator, post.admin is comprehensive to compute statistics on the subjects.
Preprocess data
Denormalized json data should be converted to tabular. Here is a phase where Dask is taken to handle multiple files and preprocess them in parallel in a pipeline. The result is saved as the column-oriented data format Parquet .
Run a cluster
from dask.distributed import Client, LocalCluster

cluster = LocalCluster(dashboard_address='127.0.0.1:8787',
                       worker_dashboard_address='127.0.0.1:0',
                       n_workers=8,
                       threads_per_worker=1,
                       memory_limit='400MiB')
client = Client(cluster)
Serialize posts
# Serialize
import json
from pathlib import Path
import dask.bag
import pandas as pd

posts_bag = (dask.bag.read_text('streamlit/latest/order-created/ascending-False/page-*/topic-*')
                     .map(json.loads)
                     .map(get_posts))
Reduce fields and filter duplicates
from tabulate import tabulate
from IPython.display import display_markdown

total = posts_bag.flatten().pluck('post.id').count().compute()
duplicated = posts_bag.flatten().pluck('post.id').frequencies(sort=True).filter(lambda item: item[1] > 1).count().compute()
| total | duplicated |
|---|---|
| 44147 | 210 |
# Select necessary fields, drop duplicates, save on disk
def select_keys(dict_, *keys):
    d = {key: value for key, value in dict_.items() if key in keys}
    return d

posts_bag = posts_bag.flatten().map(select_keys, 'topic.id', 'post.user_id', 'post.username', 'post.id', 'post.created_at', 'post.post_number', 'post.staff', 'post.moderator', 'post.admin')
posts_bag = posts_bag.distinct('post.id')

posts_ddf = posts_bag.to_dataframe()
posts_ddf.to_parquet('files/preprocessed/')
Analyse data
Data is ready to compute statistics and find trends.
Extract moderatos. Summary view
# Filter moderators, admins, staff
posts_df = pd.read_parquet('files/preprocessed/part.0.parquet')
moderators_df = posts_df[posts_df[['post.admin', 'post.moderator', 'post.staff']].any(axis=1)]

groupped = moderators_df.groupby(['post.user_id', 'post.username'])
counts = groupped.size().rename('count')
firsts = groupped.first().loc[:, ['post.admin', 'post.moderator', 'post.staff']]
summary_df = pd.merge(counts, firsts, left_index=True, right_index=True).sort_values('count', ascending=False)
summary_df = summary_df.reset_index()
| post.user_id | post.username | count | post.admin | post.moderator | post.staff | |
|---|---|---|---|---|---|---|
| 0 | 1064 | randyzwitch | 5278 | True | False | True |
| 1 | -1 | system | 1294 | True | True | True |
| 2 | 4771 | snehankekre | 931 | True | True | True |
| 3 | 5621 | Caroline | 864 | True | True | True |
| 4 | 706 | andfanilo | 786 | False | True | True |
| 5 | 1108 | Charly_Wargnier | 610 | True | True | True |
| 6 | 11947 | blackary | 472 | False | True | True |
| 7 | 6 | thiago | 300 | False | True | True |
| 8 | 1326 | okld | 233 | False | True | True |
| 9 | 2 | tc1 | 179 | True | True | True |
| 10 | 18 | tim | 157 | False | True | True |
| 11 | 2511 | Jessica_Smith | 132 | False | True | True |
| 12 | -2 | streamlitbot | 122 | True | False | True |
| 13 | 686 | arnaud | 102 | True | True | True |
| 14 | 2064 | kmcgrady | 98 | False | True | True |
| 15 | 3241 | jrieke | 90 | False | True | True |
| 16 | 4146 | dataprofessor | 46 | False | True | True |
| 17 | 228 | kantuni | 45 | False | True | True |
| 18 | 14194 | tonykip | 25 | True | True | True |
| 19 | 3819 | vdonato | 24 | False | True | True |
| 20 | 15351 | StreamlitTeam | 15 | True | True | True |
| 21 | 13976 | jcarroll | 12 | False | True | True |
| 22 | 16008 | Alexandru_Toader | 8 | False | True | True |
| 23 | 10717 | kseniaanske | 2 | True | True | True |
# Visualize as three divisions
summary_df['response_amount'] = pd.qcut(summary_df['count'], 3, labels=['small', 'medium', 'big'])
sns.set_style('white')
sns.catplot(data=summary_df,
            x='count', y='post.username',
            col='response_amount', col_order=['big', 'medium', 'small'],
            kind='bar', sharey=False, sharex=False,
            color=sns.color_palette("flare_r")[0],
)
sns.despine(left=True, bottom=True)
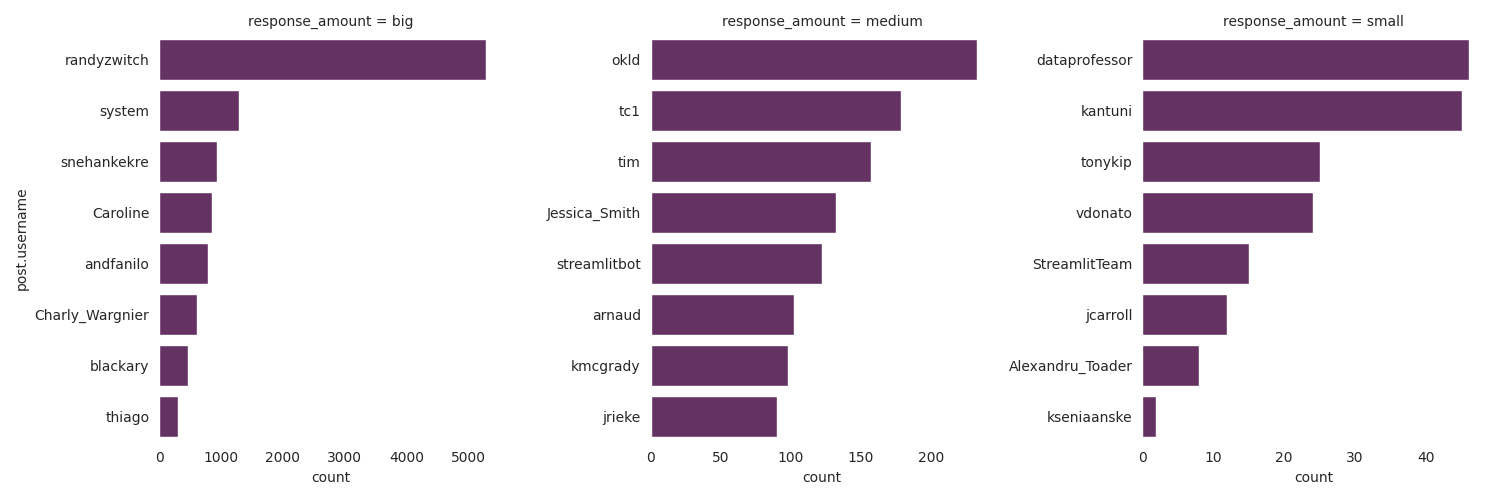
The top two moderators are the most active, and the second is a bot. randyzwitch is the only leader here.
Responded topics disrtibution
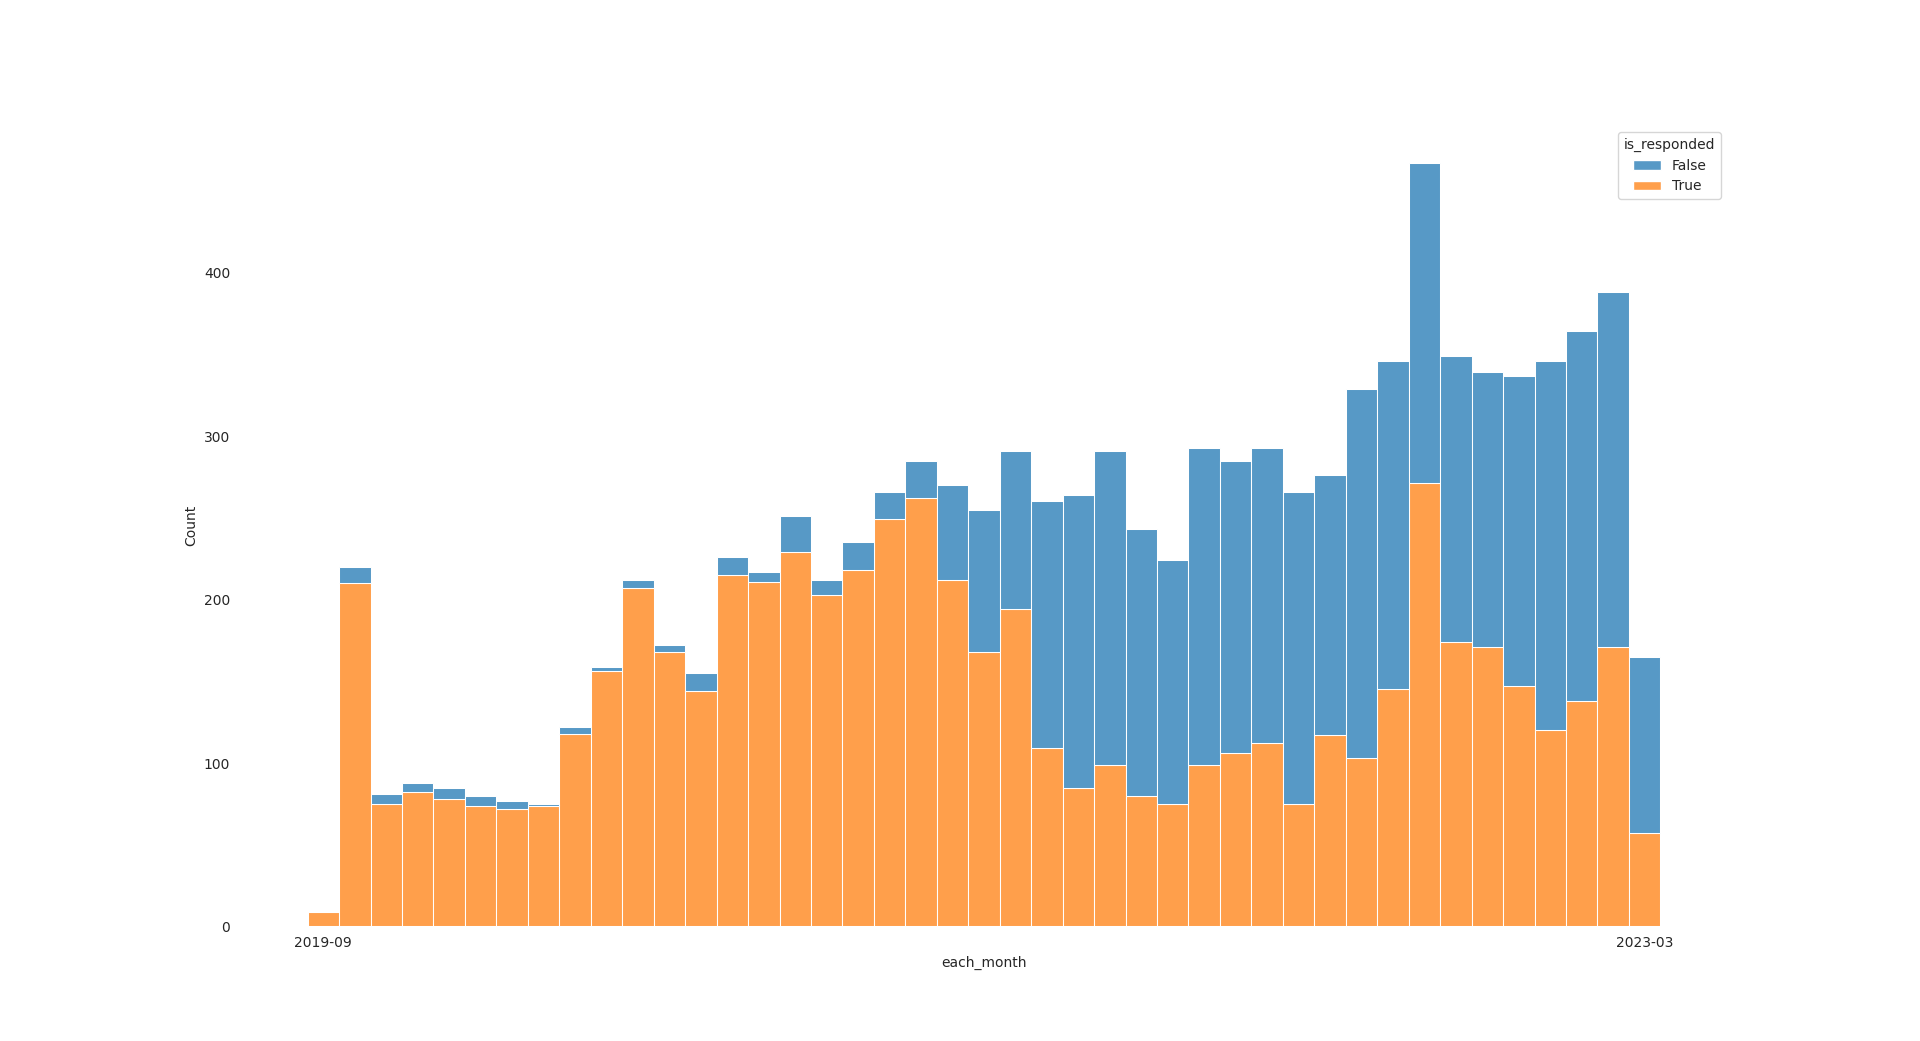
Responses distribution over the whole community lifetime.
# Drop bots, add flags and convert datetime
posts_df = posts_df[~posts_df['post.username'].isin(['system', 'streamlit'])]
posts_df['is_moderator'] = posts_df[['post.staff', 'post.moderator','post.admin']].any(axis=1)
posts_df['post.created_at'] = pd.to_datetime(posts_df['post.created_at'])

# Figure out whether the first posts were responded and when
responded = posts_df.groupby('topic.id').aggregate({'is_moderator': 'any', 'post.created_at': 'min'})
responded.rename(columns={'is_moderator': 'is_responded'}, inplace=True)
responded['each_month'] = responded['post.created_at'].dt.strftime('%Y-%m')

# Visualize distribution
sns.set_style('white')
hist = sns.histplot(responded, x='each_month', hue='is_responded', multiple='stack')
sns.despine(left=True, bottom=True)
hist.tick_params(left=False)
last_pos = hist.get_xticks()[-1]
hist.set_xticks([0, last_pos],
                labels=[responded['each_month'].iloc[0],
                        responded['each_month'].iloc[-1]]
)
Findings:
- Interestingly, on the right part of the picture, there are lots of unresponded topics.
- The response frequency is decreased on the right part.
- Almost all topics on the left are responded. I guess they are simply closed after a long while.
First response delay stats
How fast moderators respond to a new topic.
posts_df['is_first_post'] = posts_df['post.post_number'] == 1
first_posts = posts_df[(posts_df['is_first_post']) & (~posts_df['is_moderator'])].sort_values('topic.id')
first_responses = posts_df[posts_df['is_moderator']].sort_values('post.created_at').groupby('topic.id', as_index=False).first()

# Set indexes for joining
first_posts.set_index('topic.id', verify_integrity=True, inplace=True)
first_responses.set_index('topic.id', verify_integrity=True, inplace=True)
responded = first_posts.join(first_responses, how='inner', lsuffix='.posts', rsuffix='.responses')
responded = responded[['post.username.posts', 'post.created_at.posts', 'post.username.responses', 'post.created_at.responses']]
responded['first_response_delay'] = responded['post.created_at.responses'] - responded['post.created_at.posts']

responded['first_response_delay'].describe()
| first_response_delay | |
|---|---|
| count | 5584 |
| mean | 145 days 04:17:46.949290294 |
| std | 234 days 06:39:18.775907688 |
| min | 0 days 00:00:01.231000 |
| 25% | 0 days 05:39:14.983000 |
| 50% | 1 days 18:19:36.327500 |
| 75% | 393 days 23:08:31.948750 |
| max | 1093 days 14:33:57.247000 |
Too big dispearson. The dataset should get trimmed up to compute a better fit, due to huge difference between 50% and both 75%, max measurements.
Three quantiles are inspected sepately, min - 50%, 50% - 75%, 75% - max. Checking a count of each first.
pd.qcut(responded['first_response_delay'],
        [0, .5, .75, 1],
        labels=['min - 50%', '50% - 75%', '75% -max'])\
  .value_counts()
| first_response_delay | |
|---|---|
| min - 50% | 2792 |
| 50% - 75% | 1396 |
| 75% - max | 1396 |
Each of them contains the significant amount of responses. I think the responses are given within 393 and 1093 days shoudn't be considered as abnormaly big and have zero value to the questioners.
The seconds unit isn't appropriate for reporting, converting to hours.
# Take 0.5 and hours
responded['first_response_delay_hours'] = responded['first_response_delay']  / pd.Timedelta('1 hour')
responded_lte_50 = responded.loc[responded['first_response_delay'] <=  responded['first_response_delay'].quantile(0.5)]
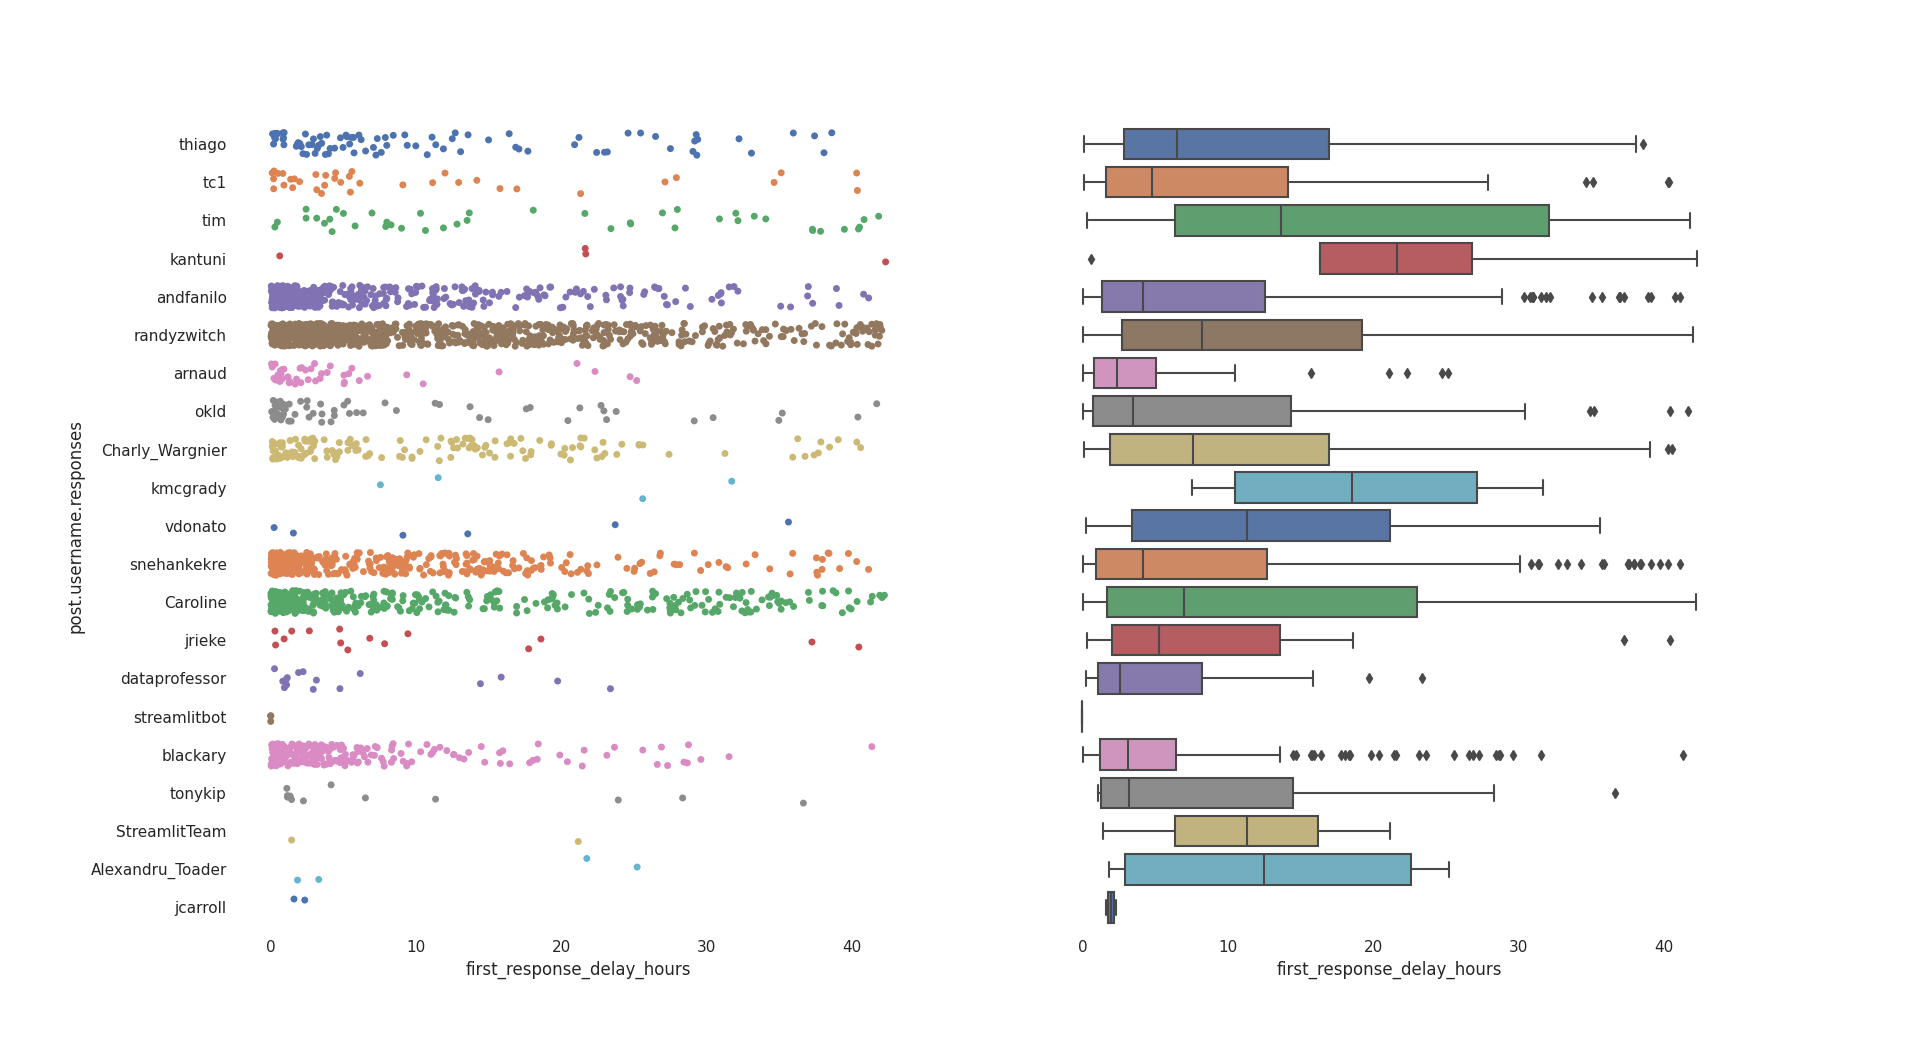
The representative sample responded_lte_50 is filtered, visualize its distribution and descriptive statistics.
sns.set_theme(style='white')
sns.set_style({
    'axes.spines.left': False,
    'axes.spines.bottom': False,
    'axes.spines.right': False,
    'axes.spines.top': False
})

f, axs = plt.subplots(1, 2)
sns.stripplot(responded_lte_50,
              x='first_response_delay_hours', y='post.username.responses',
              hue='post.username.responses', palette='deep',
              legend=False, jitter=0.3, ax=axs[0])
box = sns.boxplot(responded_lte_50,
                  x='first_response_delay_hours', y='post.username.responses',
                  palette='deep', ax=axs[1])
box.yaxis.set_ticklabels('')
box.yaxis.set_label_text('')
Findings:
- The majority responses within
~25hours or one day. - A few come to the community even later.
Common delay stats
The common stats as a summary of those above.
sns.set_theme(style='dark')
box = sns.boxenplot(responded_lte_50, x='first_response_delay_hours', color='xkcd:mauve', linewidth=0.5)
locs = box.xaxis.get_ticklocs()
locs = locs.tolist()
agg_ticks = responded_lte_50['first_response_delay_hours'].agg([lambda s: s.quantile(0.25),
                                                                'median',
                                                                lambda s: s.quantile(0.75)])
for agg in reversed(agg_ticks.to_list()):
    locs.insert(1, round(agg, 2))
box.xaxis.grid(True)
box.xaxis.set_ticks(locs)
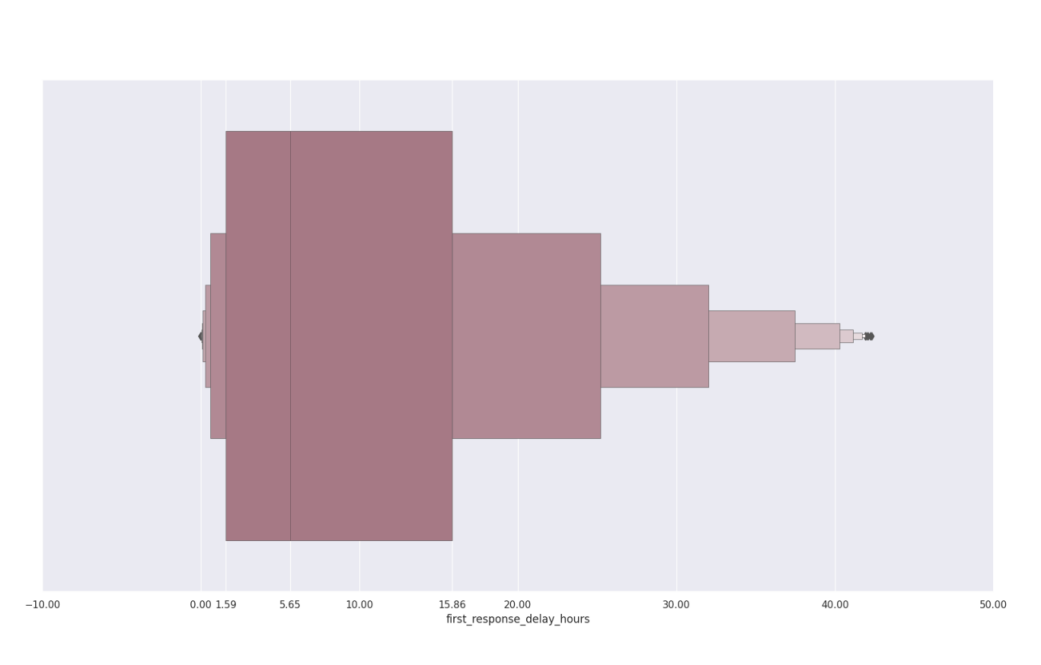
5.6 hours is the average time you will get responded to by a moderator within 1.59 - 15.86 hours on Streamlit community ..